
")
")
")
InfoCredit Business Activity Index
- In 2022, CEIDG received a total of over a million applications for establishing, resuming, suspending and terminating business activity. This is the most in 9 years, i.e. since 2014.
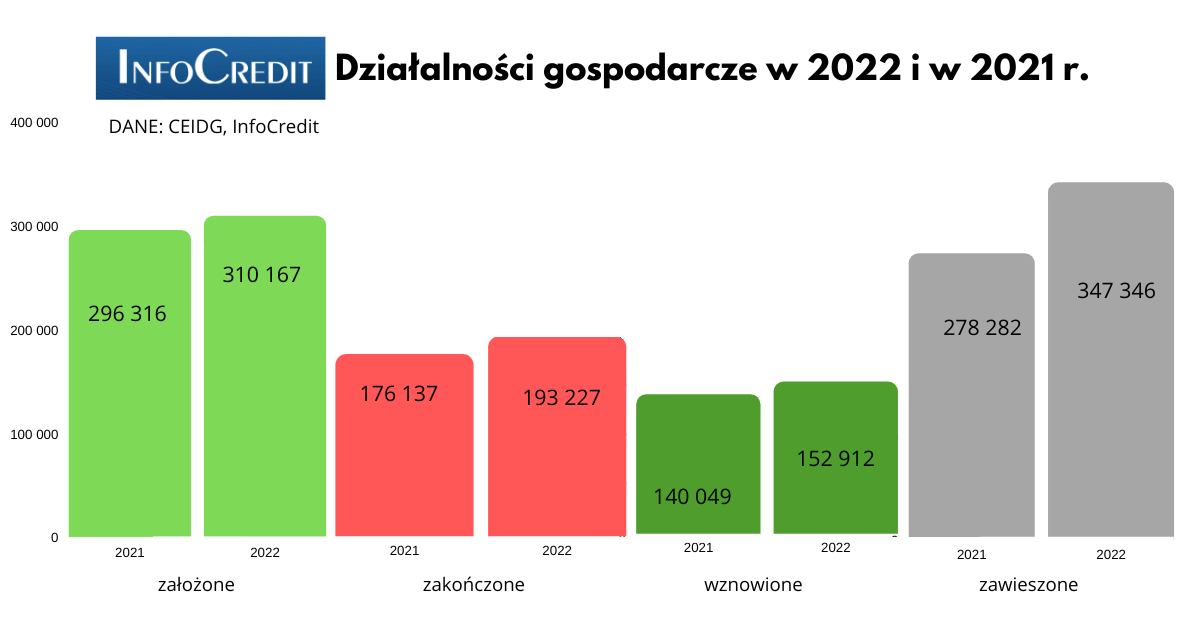
- However, the vast majority of applications concerned the suspension of activities. There were as many as 347.3 thousand of them. It's a record.
- Last year, 193.2 thous. activity – the most since 2014
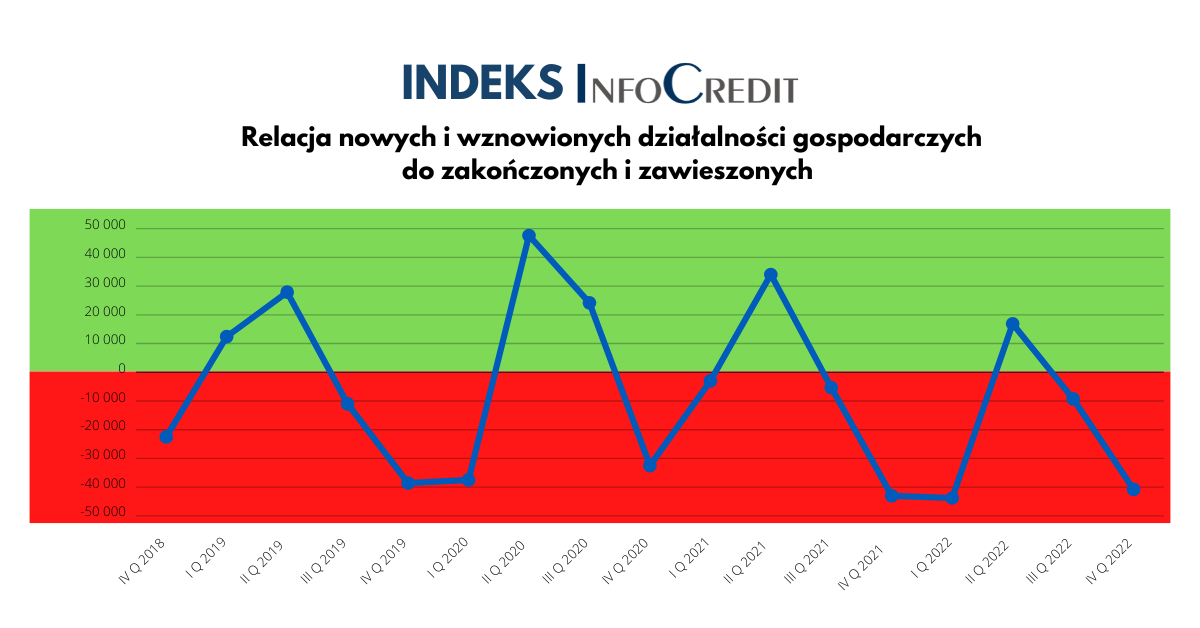
- The InfoCredit business activity index calculated on a quarterly basis fell to the value from the turn of 2021 and 2022. Counting year on year and taking into account seasonality, it is sinking lower and lower.
After two years of a significant decrease in the activity of Poles due to the epidemic last year, we finally recorded a significant increase in applications submitted to CEIDG. In 2020 and 2021, there were almost 850,000 and 891,000, respectively. Last year, exactly 1,003,653. It would be cause for optimism if most of them concerned new businesses. Unfortunately, it is not. There were a total of 463.1 thousand new and resumed activities, completed and suspended 540.6 thousand.
Particularly disturbing as many as 347.3 thousand. applications for suspension of business activity. This is a record result. 193.2 thousand were completed, the most since 2014 and 2013, when there were 208.2 thousand and 208.2 thousand respectively. and 235.6 thous.
Applications for suspensions did not come in leaps and bounds at the end of the year, but gradually throughout the year. In the first half of the year, there were 161.3 thousand. (in the first half of 2021, 115.6 thousand). In the second half of the year, 186.1 thous. against 162.7 thous. in the corresponding period of 2021. In the fourth quarter, 97.7 thousand suspensions were recorded. against 90 thousand in the last three months of 2021, only December 2022 was calmer. 39.6 thousand were suspended at that time. activity compared to 42.4 thous. in December 2021. At the end of 2021, however, we recorded a significant increase in closed and suspended activities, because entrepreneurs did not like the mess and ambiguity related to the Polish Order.
The last three years are difficult to compare, because they brought a significant increase in uncertainty and events that we have not seen before. 2020 and 2021 are the time of epidemics and restrictions. The turn of 2021 and 2022 brought us the Polish Deal, huge confusion in tax regulations and rising inflation. The last 11 months have already seen a huge increase in the costs of running a business, not only due to additional tax and contribution burdens, but above all due to a sharp increase in the prices of raw materials and energy. Therefore, first, in 2020 and 2021, we observed a decrease in activity in submitting applications to CEIDG, and now we see more and more of them. Closures do not come so quickly, because it is easier to go into limbo to observe the situation and postpone the decision.
The situation in general statistics is slightly improved by the increase in the number of established and resumed activities. We recorded 310.2 thousand new ones in 2022, 152.9 thousand renewed ones, i.e. a total of 463.1 thousand. (in 2020 and 2021, respectively 425.3 and 436.4 thousand). However, it is still far from the best years in this respect, i.e. 2017 and 2018, when there were a total of over 491,000.
The upward trend of suspended activities has been maintained since mid-2021, when the assumptions of the Polish Deal were presented. There is no indication that it will end soon. The beginning of 2023 was not good either. By January 23, 27.7 thousand jobs were established and resumed. activities, as many as 40.5 thousand were completed and suspended.
Conclusions per year
|
Year |
Assumption* |
End |
Suspension |
Sum |
|
2022 |
463 080 |
193 227 |
347 346 |
1 003 653 |
|
2021 |
436 365 |
176 137 |
278 282 |
890 784 |
|
2020 |
425 334 |
142 375 |
281 809 |
849 518 |
|
2019 |
470 184 |
173 320 |
306 853 |
950 357 |
|
2018 |
491 647 |
177 083 |
303 270 |
972 000 |
|
2017 |
491 234 |
178 898 |
309 242 |
979 374 |
|
2016 |
465 970 |
181 053 |
307 132 |
954 155 |
|
2015 |
476 947 |
192 987 |
311 854 |
981 788 |
|
2014 |
487 240 |
208 188 |
314 652 |
1 010 080 |
|
2013 |
486 902 |
235 630 |
312 548 |
1 035 080 |
|
2012 |
423 655 |
49 968 |
297 380 |
771 003 |
|
Sum |
5 118 558 |
1 908 866 |
3 370 368 |
10 397 792 |
* Includes applications for establishment and resumption of business. Source: CEIDG
InfoCredit business activity index
Starting this year, we are changing the rules for presenting the InfoCredit business activity index. Instead of showing the ratio of new to closed and relaunched to suspended businesses, we will publish the ratio of new and resumed to closed and suspended. When the index is positive, it means that more activities have been established and suspended than were suspended and closed. The higher the index value, the greater the propensity to open small businesses. Similarly, when the index indicates values below zero, it means a retreat from this form of economic activity. The more the index is in the red, the more small entrepreneurs withdraw from business (definitely or temporarily).
The index is initially presented on a quarterly basis. After January, we will also present it on a monthly basis.
#statystyki #RynekPracy #IndeksInfoCredit #mikroprzedsiębiorczość #koniunktura #mikrofirmy #mikroprzedsiębiorcy